The Market is Noise.
Every day, you fight against thousands of tickers, news, and panic. Finding a pattern with the naked eye is exhausting.
Most traders lose not because they lack skill, but because they lack memory.
We don’t predict. We remember
DCMM is a statistical engine. When a stock drops, it scans 10 years of history to find “Historical Twins”. It asks: “In the last 50 times this happened, what did the price do next?”
The 5 Levels of Clarity
| Feature | Lite (Free) | Core | Extended | Deep | Algo (coming soon) |
| Mobile PDF/HTML | ✅ | ✅ | ✅ | ✅ | ✅ |
| Probability P(Up) | ✅ | ✅ | ✅ | ✅ | ✅ |
| Stop Loss | ❌ | ✅ | ✅ | ✅ | ✅ |
| Full Market Scan | ❌ | ✅ | ✅ | ✅ | ✅ |
| Extended Probabilities | ❌ | ✅ | ✅ | ✅ | ✅ |
| Gaps, Vol Ratio | ❌ | ❌ | ✅ | ✅ | ✅ |
| Safety Moving | ❌ | ❌ | ✅ | ✅ | ✅ |
| Z-Score / Volatility | ❌ | ❌ | ❌ | ✅ | ✅ |
| Kelly / Sharpe | ❌ | ❌ | ❌ | ❌ | ✅ |
| 10-Year History CSV | ❌ | ❌ | ❌ | ❌ | ✅ |
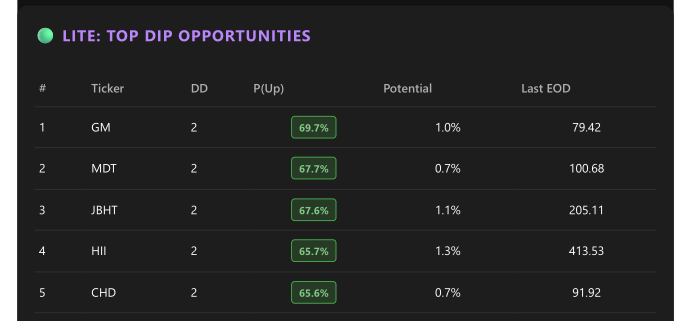
1: The Scout (LITE Access)
For the busy trader. Mobile-friendly PDF dashboard showing only the safest setups (20+ matches).
- Key Metrics: P(Up) & Potential.
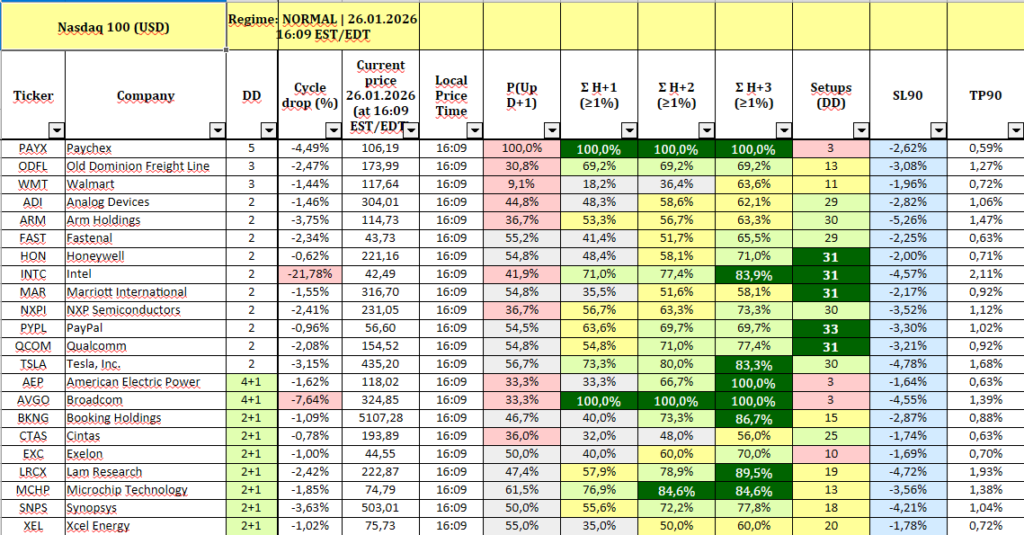
2: The Guardian (CORE Access)
For the disciplined trader. Adds Risk Management.
Key Upgrades:
- Historical probability of growth by >1% within 3 days ahead (Day 1-3).
- Stop Loss & Take Profit). You know exactly when to exit.
- Setups of Down Days – historical twince caces
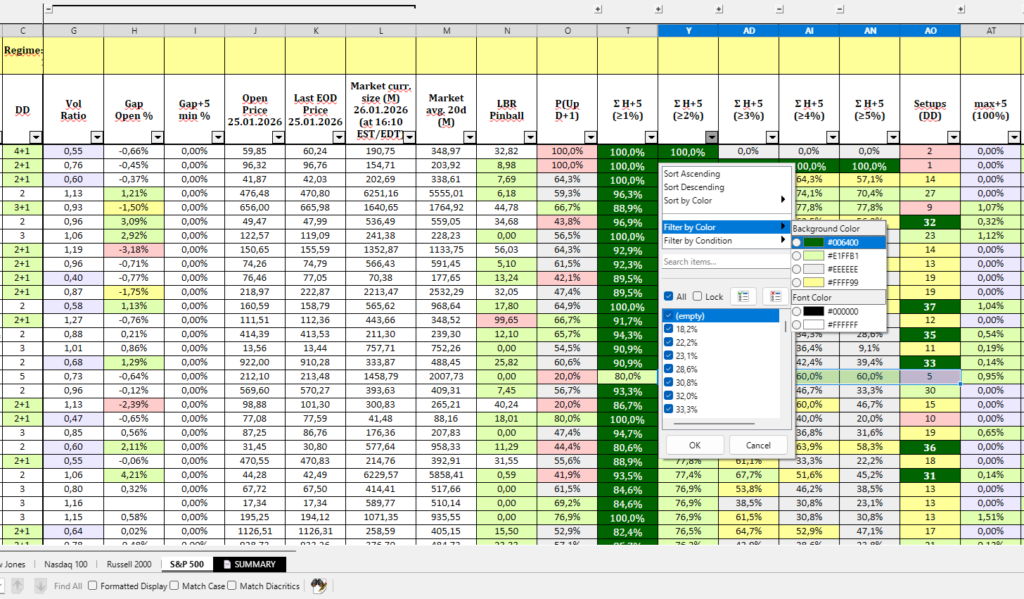
3: The Sniper (Extended Access)
For the Swing traders. Deep anomalies analise
- Extended probabilities: search for 5 days ahead (Days 1-5).
- Move Probability: Chance of a strong move (growth >2%, >3%, >4%, >5%).
- Gap_open % and Gap_5_min %
- Trade Volume Ratio
- LBR Pinball. Based on concepts popularized by Linda Raschke
- Smart Stops
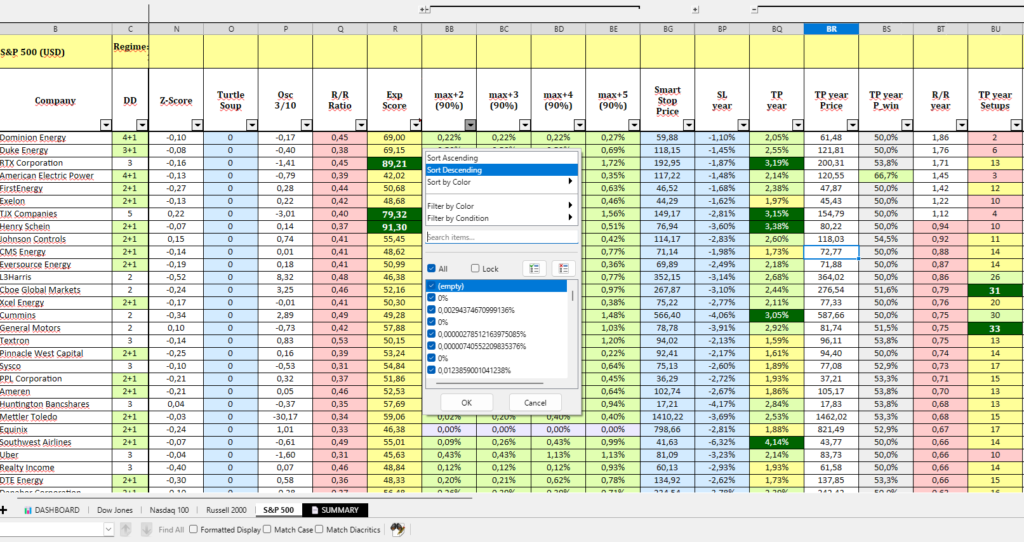
2: The Professor (DEEP Access)
For Quants and Pros. Mathematical advantage
- Z-Score. Is this drop a real anomaly or just noise?
- Risk/Reward Ratio
- Expectation Score
- Yearly Stats (How did this setup perform in the last 12 months?).
- Wide Stop Losses.
- etc…
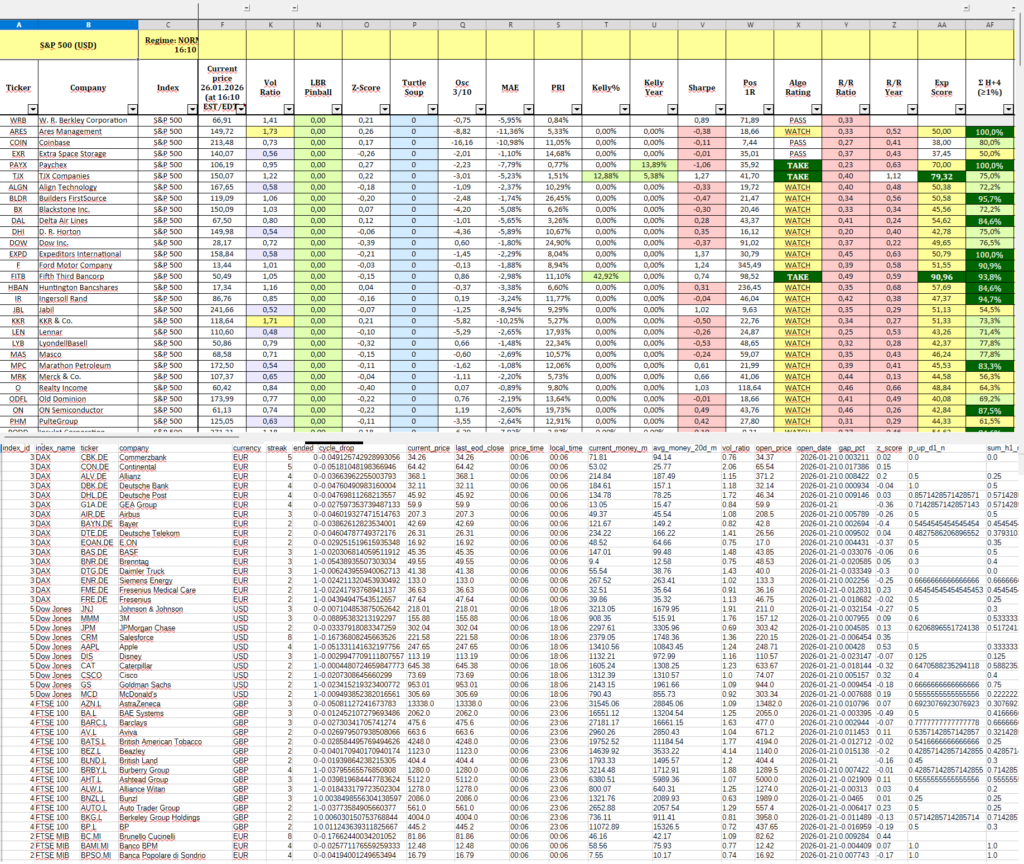
We unlock the “Quant Columns” in your report — metrics usually reserved for institutional terminals (Bloomberg/Eikon):
- 🧠 Kelly Criterion (
Kelly%):
- The Math: Based on the win rate and risk/reward ratio of this specific ticker.
- The Value: Tells you exactly how much of your bankroll to bet to mathematically maximize geometric growth. Stop guessing your position size.
- 📉 MAE (Maximum Adverse Excursion):
- The Math: The average drawdown a winning trade suffers before turning profitable.
- The Value: The ultimate tool for setting Stop Losses. If MAE is -1.5%, setting a stop at -1.0% is suicide. MAE tells you the “breathing room” the price needs.
- ⚖️ Sharpe Ratio:
- The Value: Filters out “lucky” stocks. We show you setups that generate returns with the lowest volatility per unit of risk.
- 💾 The “Golden” CSV (History):
- The Value: FiltersYou get access to the Raw Historical Data generated by our engine.
- Feed directly into your Python scripts (
pandas,backtrader) to validate your own strategies over 10 years of data.
3: The Architect (ALGO Access)
For Developers.
Target: Python Developers, Quants, System Builders.
While other levels give you a “fish” (a signal), ALGO gives you the ocean physics. This tier is designed for traders who build their own systems, backtest strategies, or manage larger portfolios using mathematical precision.
Why Upgrade to Algo?
Why the ‘Architect’ pays more:
- Manual Trader: Asks “Will AAPL go up?”
- The Architect: Asks “What is the optimal position size (Kelly%) to maximize growth while keeping Drawdown under 6%?”
The ALGO report answers the second question.
The levels compare
| Metric / Feature | Lite (Free) | Core | Extended | Deep | Algo |
| Format | PDF (dashboard) / Excel | PDF (dashboard) / Excel | PDF (dashboard) / Excel | PDF (dashboard) / Excel | PDF (dashboard) / Excel / CSV (Raw) |
| Setups Filter | Over 20 twins only | All | All | All | All |
| Basic Metrics | |||||
| Ticker & Price | ✅ | ✅ | ✅ | ✅ | ✅ |
| Days Down (Streak) | ✅ | ✅ | ✅ | ✅ | ✅ |
| Cycle Drop % | ✅ | ✅ | ✅ | ✅ | ✅ |
| P(Up) Probability | ✅ | ✅ | ✅ | ✅ | ✅ |
| Potential (Est. Move) | ✅ | ❌ | ❌ | ❌ | ❌ |
| Risk Management | |||||
| Stop Losses | ❌ | ✅ | ✅ (smart) | ✅ (wide) | ✅ (wide) |
| Take Profits | ❌ | ✅ | ✅ | ✅ (wide) | ✅ (wide) |
| Probabilities Horizon | ❌ | ✅ Days 1 – 3 | ✅ Days 1 – 5 | ✅ Days 1 – 5 | ✅ Days 1 – 5 |
| Move Strength P(>S%) | ❌ | ✅ >1% Only | ✅ >1%,>2%…>5% | ✅ >1%,>2%…>5% | ✅ >1%,>2%…>5% |
| Conservative Floor (max+k) | ❌ | ❌ | ✅ | ✅ | ✅ |
| Advanced Filters | |||||
| Vol Ratio (Volume) | ❌ | ❌ | ✅ | ✅ | ✅ |
| RSI (14) | ❌ | ❌ | ✅ | ✅ | ✅ |
| ADX (14) | ❌ | ❌ | ✅ | ✅ | ✅ |
| LBR Pinball | ❌ | ❌ | ✅ | ✅ | ✅ |
| Gap % Analysis | ❌ | ❌ | ✅ | ✅ | ✅ |
| Market Cap Filter | ❌ | ❌ | ✅ | ✅ | ✅ |
| Deep Analytics | |||||
| Z-Score (Anomaly) | ❌ | ❌ | ❌ | ✅ | ✅ |
| Turtle Soup Pattern | ❌ | ❌ | ❌ | ✅ | ✅ |
| Oscillator 3/10 | ❌ | ❌ | ❌ | ✅ | ✅ |
| Expectancy Score | ❌ | ❌ | ❌ | ✅ | ✅ |
| Pro / Quant | |||||
| Kelly Criterion % | ❌ | ❌ | ❌ | ❌ | ✅ |
| Sharpe Ratio | ❌ | ❌ | ❌ | ❌ | ✅ |
| Yearly Stats (Win%) | ❌ | ❌ | ❌ | ❌ | ✅ |
| 10-Year History File | ❌ | ❌ | ❌ | ❌ | ✅ |